Kubernetes Troubleshooting Guide: Production Issues, RCA & Solutions
Rohit Kumar
•
25 February 2026
•
14 mins
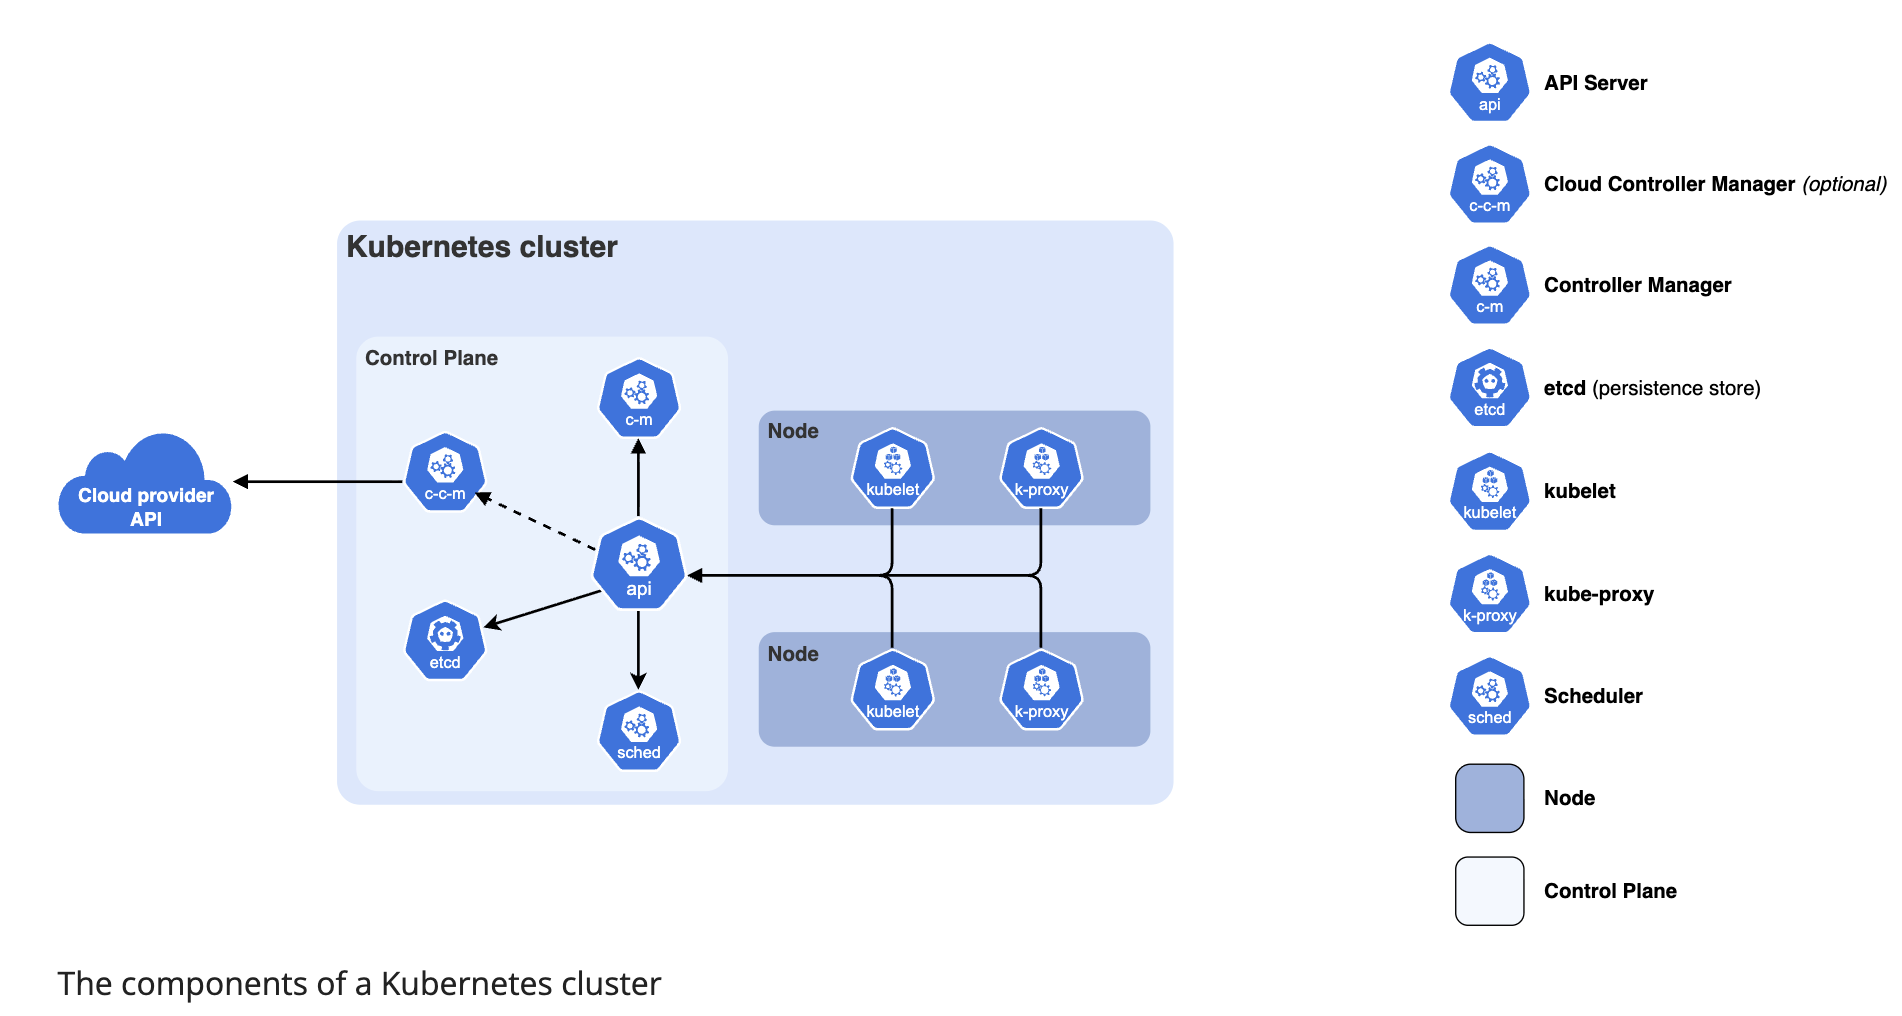
Complete Kubernetes Troubleshooting Guide: Production Issues, RCA & Solutions
Part 1: Troubleshooting Methodology
A chaotic approach wastes time and risks misdiagnosis — especially critical in production. Always follow a structured methodology.
The 5-Step Framework
1. IDENTIFY   → What exactly is broken?
2. GATHER     → Collect logs, events, resource states
3. ANALYZE    → Form a hypothesis from the data
4. FIX        → Apply a targeted solution
5. VERIFY     → Confirm fix, check for side effects
The Diagnostic Hierarchy
Always work top-down, from application to infrastructure:
Application Layer    →  Pod logs, exit codes, probe failures
      ↓
Service Layer        →  Endpoints, selectors, DNS resolution
      ↓
Node Layer           →  kubelet, resource pressure, node status
      ↓
Control Plane Layer  →  API server, scheduler, controller manager, etcd
      ↓
Infrastructure Layer →  Network, storage, OS, hardware
Part 2: Pod-Level Troubleshooting
2.1 Pod Status Reference Table
| Status | Meaning | First Action |
|---|---|---|
Pending |
Not yet scheduled | kubectl describe pod → Events |
ContainerCreating |
Scheduled, pulling image or mounting volumes | kubectl describe pod |
ImagePullBackOff |
Cannot pull container image | Check image name, registry credentials |
CrashLoopBackOff |
Container starts then crashes repeatedly | kubectl logs --previous |
OOMKilled |
Exceeded memory limit | Increase memory limit or fix memory leak |
Error |
Container exited with non-zero code | kubectl logs for app error |
Terminating |
Pod stuck during deletion | Check for finalizers |
Unknown |
Node communication lost | Check node status |
Running but not ready |
Readiness probe failing | kubectl describe pod → probe events |
2.2 Pod Stuck in Pending
Root Causes & RCA:
RCA 1 — Insufficient Node Resources
# Step 1: Describe the pod — read the Events section
kubectl describe pod <pod-name> -n <namespace>

# Look for messages like:
# "0/3 nodes are available: 3 Insufficient cpu"
# "0/3 nodes are available: 3 Insufficient memory"

# Step 2: Check node allocatable resources
kubectl describe node <node-name>
# Look for: Allocatable vs Requests in the resource section

# Step 3: See what's consuming resources
kubectl top nodes
kubectl top pods -A --sort-by=cpu
kubectl top pods -A --sort-by=memory
Solution:
# Option A: Scale down other workloads
kubectl scale deployment <other-app> --replicas=1

# Option B: Reduce pod resource requests
kubectl edit deployment <deployment-name>
# Lower spec.containers[].resources.requests

# Option C: Add a new node to the cluster
# Then verify it joins
kubectl get nodes
RCA 2 — Node Affinity / Selector Mismatch
# Describe pod — look for:
# "didn't match Pod's node affinity/selector"
kubectl describe pod <pod-name>

# Check what labels your nodes have
kubectl get nodes --show-labels

# Check what the pod is requiring
kubectl get pod <pod-name> -o yaml | grep -A 20 affinity
Solution:
# Option A: Add the required label to a node
kubectl label node <node-name> disk-type=ssd

# Option B: Fix the affinity rule in the deployment
kubectl edit deployment <deployment-name>
# Correct the matchExpressions values
RCA 3 — Taint / Toleration Mismatch
# Describe pod — look for:
# "node(s) had taint {key:value}, that the pod didn't tolerate"
kubectl describe pod <pod-name>

# Check node taints
kubectl describe node <node-name> | grep Taints
Solution:
# Add toleration to pod spec
tolerations:
- key: "key"
  operator: "Equal"
  value: "value"
  effect: "NoSchedule"
RCA 4 — Unbound PersistentVolumeClaim
# Describe pod — look for:
# "persistentvolumeclaim <name> not found" or "unbound"
kubectl describe pod <pod-name>

# Check PVC status
kubectl get pvc -n <namespace>

# Check available PVs
kubectl get pv
Solution:
# Check if PV exists with matching storageClass, accessMode, and capacity
kubectl describe pvc <pvc-name>
kubectl describe pv <pv-name>

# If no matching PV exists, create one
# Or ensure your StorageClass provisioner is running
kubectl get pods -n kube-system | grep provisioner
2.3 Pod in ImagePullBackOff
# Step 1: Get the exact error
kubectl describe pod <pod-name>
# Events will show: "Failed to pull image: <specific error>"

# Step 2: Verify the image name and tag manually
# Common mistakes: typos, wrong tag, private registry without credentials
RCA 1 — Wrong Image Name or Tag
# Check what image is specified
kubectl get pod <pod-name> -o yaml | grep image

# Verify the image exists in the registry
docker pull <image-name>:<tag>
Solution:
# Correct the image in the deployment
kubectl set image deployment/<name> \
  <container-name>=<correct-image>:<correct-tag>
RCA 2 — Private Registry — Missing Credentials
# Check if imagePullSecret is configured
kubectl get pod <pod-name> -o yaml | grep imagePullSecret

# Check if the secret exists
kubectl get secret -n <namespace>
Solution:
# Create registry credentials secret
kubectl create secret docker-registry regcred \
  --docker-server=<registry-url> \
  --docker-username=<username> \
  --docker-password=<password> \
  --docker-email=<email> \
  -n <namespace>
# Reference it in pod spec
spec:
  imagePullSecrets:
  - name: regcred
  containers:
  - name: app
    image: private-registry.io/app:v1
2.4 Pod in CrashLoopBackOff
This is the most complex pod failure — the container starts but immediately crashes.
# Step 1: Get current logs
kubectl logs <pod-name> -n <namespace>

# Step 2: Get logs from the PREVIOUS crashed container (most useful)
kubectl logs <pod-name> -n <namespace> --previous

# Step 3: Check exit code and last state
kubectl describe pod <pod-name>
# Look for: Last State → Exit Code
Exit Code Reference:
| Exit Code | Meaning | Likely Cause |
|---|---|---|
0 |
Success | Misconfigured as a one-shot job |
1 |
General error | Application error — check logs |
137 |
SIGKILL (128+9) | OOMKilled or manual kill |
139 |
Segfault (128+11) | Application bug |
143 |
SIGTERM (128+15) | Graceful shutdown — check why |
255 |
Exit status out of range | Application startup failure |
RCA 1 — Application Crash (check logs)
kubectl logs <pod-name> --previous
# Read the stack trace or error message carefully
Solution: Fix the application bug, misconfiguration, or missing dependency.
RCA 2 — Failing Liveness Probe Killing the Pod
kubectl describe pod <pod-name>
# Look for: "Liveness probe failed"
# And: "Container killed by liveness probe"
Solution:
# Increase initialDelaySeconds to give app more startup time
livenessProbe:
  httpGet:
    path: /health
    port: 8080
  initialDelaySeconds: 60   # increase this
  periodSeconds: 10
  failureThreshold: 3
RCA 3 — Missing ConfigMap or Secret
kubectl describe pod <pod-name>
# Look for: "configmap <name> not found"
# Or: "secret <name> not found"
Solution:
# Verify the ConfigMap/Secret exists in the correct namespace
kubectl get configmap -n <namespace>
kubectl get secret -n <namespace>

# Create if missing
kubectl create configmap <name> --from-literal=key=value -n <namespace>
RCA 4 — Container Crashes Too Fast to Get Logs
# Override the container command to keep it alive for debugging
kubectl edit deployment <name>
# Temporarily change container command
spec:
  containers:
  - name: app
    command: ["sleep", "3600"]   # override normal entrypoint
# Now exec into the running container and debug manually
kubectl exec -it <pod-name> -- /bin/sh

# Run the actual application command manually to see the error
2.5 Pod OOMKilled
# Confirm OOMKilled
kubectl describe pod <pod-name>
# Look for: Last State: Terminated  Reason: OOMKilled

# Check current memory usage vs limits
kubectl top pod <pod-name>
kubectl get pod <pod-name> -o yaml | grep -A 5 resources
RCA: Memory limit set too low for actual application usage.
Solution:
# Increase memory limit
kubectl edit deployment <deployment-name>
resources:
  requests:
    memory: "256Mi"
  limits:
    memory: "1Gi"    # increase this
Long-term fix: Profile the application’s actual memory usage under load using
kubectl top podsand set limits at ~20-30% above peak observed usage.
2.6 Pod Stuck in Terminating
# Check for finalizers blocking deletion
kubectl get pod <pod-name> -o yaml | grep finalizers
Solution:
# Remove finalizers to force deletion
kubectl patch pod <pod-name> \
  -p '{"metadata":{"finalizers":[]}}' \
  --type=merge

# Or force delete (use with caution in production)
kubectl delete pod <pod-name> --force --grace-period=0
Part 3: Service & Networking Troubleshooting
3.1 Service Unreachable — Systematic Checklist
Step 1: DNS Resolution
Step 2: Service Existence & Selector
Step 3: Endpoints Population
Step 4: Direct Pod Connectivity
Step 5: Network Policy Check
Step 6: kube-proxy Check
Step 1 — DNS Resolution
# Launch a debug pod with networking tools
kubectl run debug --image=busybox --rm -it --restart=Never -- /bin/sh

# Inside the pod, test DNS
nslookup <service-name>
nslookup <service-name>.<namespace>.svc.cluster.local

# Test external DNS too
nslookup google.com
If DNS fails → CoreDNS issue:
# Check CoreDNS pods
kubectl get pods -n kube-system -l k8s-app=kube-dns

# Check CoreDNS logs
kubectl logs -n kube-system -l k8s-app=kube-dns

# Check CoreDNS ConfigMap
kubectl get configmap coredns -n kube-system -o yaml
Step 2 — Service Selector Mismatch (Most Common Cause)
# Check the service selector
kubectl describe service <service-name> -n <namespace>
# Look for: Selector field

# Check the pod labels
kubectl get pods -n <namespace> --show-labels

# The selector MUST exactly match pod labels
# Even a single character difference breaks it
RCA Example:
# Service selector says:
selector:
  app: my-app        # ← looking for this label

# But pods have:
labels:
  app: myapp         # ← hyphen missing — NO MATCH
Solution:
# Fix the service selector
kubectl edit service <service-name>

# OR fix the pod labels
kubectl label pod <pod-name> app=my-app --overwrite
Step 3 — Empty Endpoints
# Check if the service has any backend pods
kubectl get endpoints <service-name> -n <namespace>

# Healthy output looks like:
# NAME         ENDPOINTS                         AGE
# my-service   10.244.1.5:80,10.244.2.3:80      5m

# If ENDPOINTS shows <none> — selector mismatch or no running pods
Step 4 — Direct Pod Connectivity
# Get pod IP
kubectl get pod <pod-name> -o wide

# From debug pod, try connecting directly to pod IP
wget -O- http://<pod-ip>:<port>
curl http://<pod-ip>:<port>

# If this fails → CNI plugin issue or Network Policy blocking
Step 5 — Network Policy Blocking Traffic
# List all network policies in the namespace
kubectl get networkpolicy -n <namespace>

# Describe to see ingress/egress rules
kubectl describe networkpolicy <policy-name> -n <namespace>

# Temporarily delete the policy to test
kubectl delete networkpolicy <policy-name> -n <namespace>
# If connectivity restores → policy was blocking traffic
# Restore and fix the policy rules
Step 6 — kube-proxy Issues
# Check kube-proxy pods on all nodes
kubectl get pods -n kube-system -l k8s-app=kube-proxy

# Check kube-proxy logs
kubectl logs -n kube-system <kube-proxy-pod-name>

# Verify iptables rules exist for the service
# SSH into a node
sudo iptables -t nat -L KUBE-SERVICES | grep <service-cluster-ip>
3.2 NodePort / LoadBalancer Not Accessible Externally
# Get service details — verify port assignment
kubectl get service <service-name> -o wide

# Get node IP
kubectl get nodes -o wide

# Test from outside
curl http://<node-ip>:<nodeport>
Common RCAs:
| Issue | Check | Fix |
|---|---|---|
| Firewall blocking NodePort range (30000-32767) | Cloud security groups / firewall rules | Open port range in firewall |
| Wrong node IP used | kubectl get nodes -o wide |
Use INTERNAL-IP column |
| Pod not ready | kubectl get pods |
Fix readiness probe |
| Service selector wrong | kubectl describe svc |
Fix selector |
3.3 Ingress Not Routing Traffic
# Check ingress resource
kubectl describe ingress <ingress-name> -n <namespace>

# Check ingress controller pods are running
kubectl get pods -n ingress-nginx

# Check ingress controller logs
kubectl logs -n ingress-nginx <controller-pod-name>

# Verify backend services exist
kubectl get service -n <namespace>

# Check ingress class
kubectl get ingressclass
Common RCA — Missing ingressClassName:
# Add this to your ingress spec
spec:
  ingressClassName: nginx    # must match your controller
  rules:
  - host: myapp.example.com
Part 4: Node-Level Troubleshooting
4.1 Node in NotReady State
# Step 1: Identify affected nodes
kubectl get nodes

# Step 2: Get details
kubectl describe node <node-name>
# Look for: Conditions section — check Ready condition message
# Look for: Events section
RCA 1 — kubelet Not Running
```bash
SSH into the affected node
ssh
Check kubelet status
sudo systemctl status